> ## Documentation Index
> Fetch the complete documentation index at: https://docs.layerfi.com/llms.txt
> Use this file to discover all available pages before exploring further.
# P&L Breakdown Charts
> Itemized breakdown of revenue and expenses.
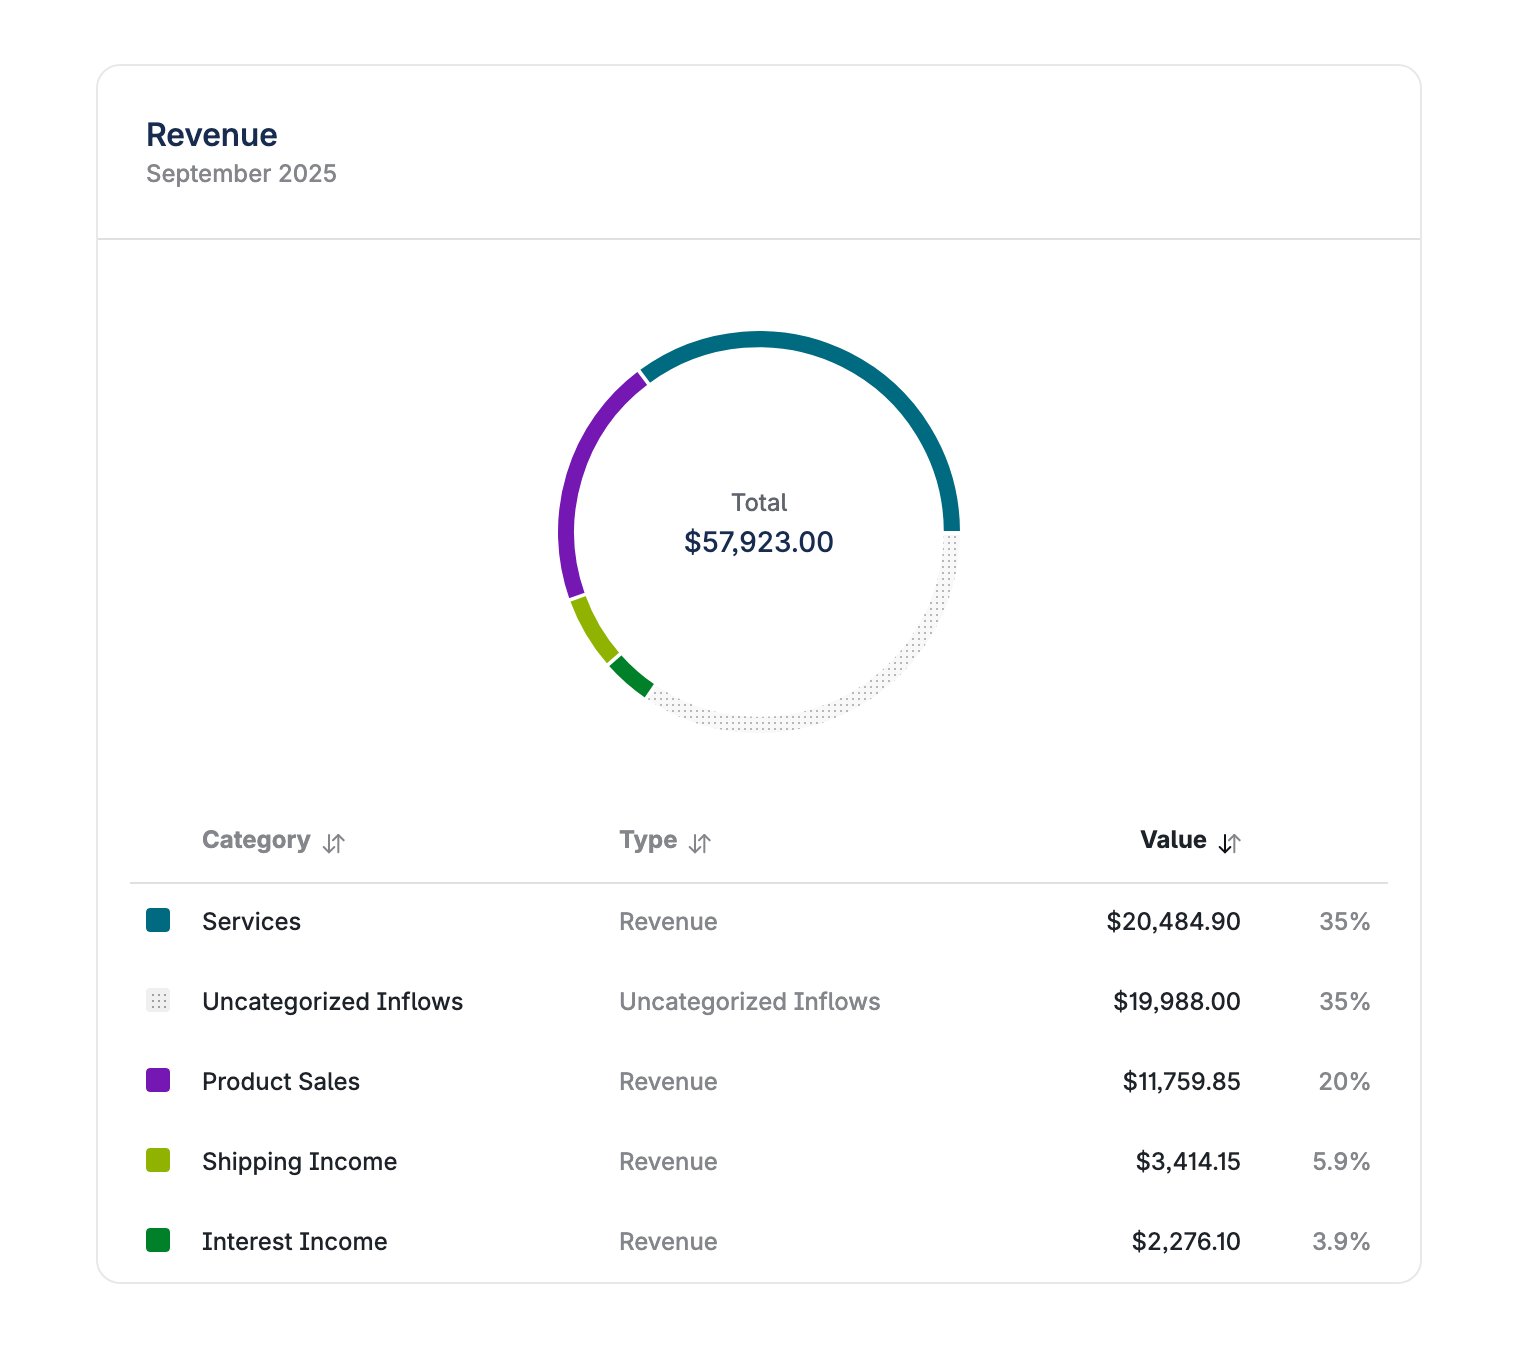 Ths P\&L Detail chart allows exploring the drivers of costs and revenue within a specific month.
```tsx theme={null}
import { ProfitAndLoss } from "@layerfi/components";
…
```
### `ProfitAndLoss.DetailedCharts` Properties
Options are `revenue` or `expenses`.
If true, shows a dedicated date picker for this component. If not, inherits the current P\&L context date range.
Optional styling overrides for the chart. Takes precedence over `chartColorsList` where both are supplied.
Ordered palette for the revenue chart. Categories are assigned colors in alphabetical order by name; if the list is shorter than the number of categories, colors repeat with reduced opacity. Only applies when `scope` is `revenue`.
Same as `revenue`, but only applies when `scope` is `expenses`.
Color for the uncategorized slice and its legend swatch. Omit to keep the default dot-pattern donut fill and neutral swatch color.
Inner radius of the donut chart.
Outer radius of the donut chart.
Legacy way to override the colors of the pie chart. Categories are assigned colors in alphabetical order by name.
If the list of colors is shorter than the number of categories, the colors will repeat with shifted opacity. Prefer `chartConfig.colors`, which also lets you set a scope-specific palette and an uncategorized color.
Ths P\&L Detail chart allows exploring the drivers of costs and revenue within a specific month.
```tsx theme={null}
import { ProfitAndLoss } from "@layerfi/components";
…
```
### `ProfitAndLoss.DetailedCharts` Properties
Options are `revenue` or `expenses`.
If true, shows a dedicated date picker for this component. If not, inherits the current P\&L context date range.
Optional styling overrides for the chart. Takes precedence over `chartColorsList` where both are supplied.
Ordered palette for the revenue chart. Categories are assigned colors in alphabetical order by name; if the list is shorter than the number of categories, colors repeat with reduced opacity. Only applies when `scope` is `revenue`.
Same as `revenue`, but only applies when `scope` is `expenses`.
Color for the uncategorized slice and its legend swatch. Omit to keep the default dot-pattern donut fill and neutral swatch color.
Inner radius of the donut chart.
Outer radius of the donut chart.
Legacy way to override the colors of the pie chart. Categories are assigned colors in alphabetical order by name.
If the list of colors is shorter than the number of categories, the colors will repeat with shifted opacity. Prefer `chartConfig.colors`, which also lets you set a scope-specific palette and an uncategorized color.