> ## Documentation Index
> Fetch the complete documentation index at: https://docs.layerfi.com/llms.txt
> Use this file to discover all available pages before exploring further.
# Chart
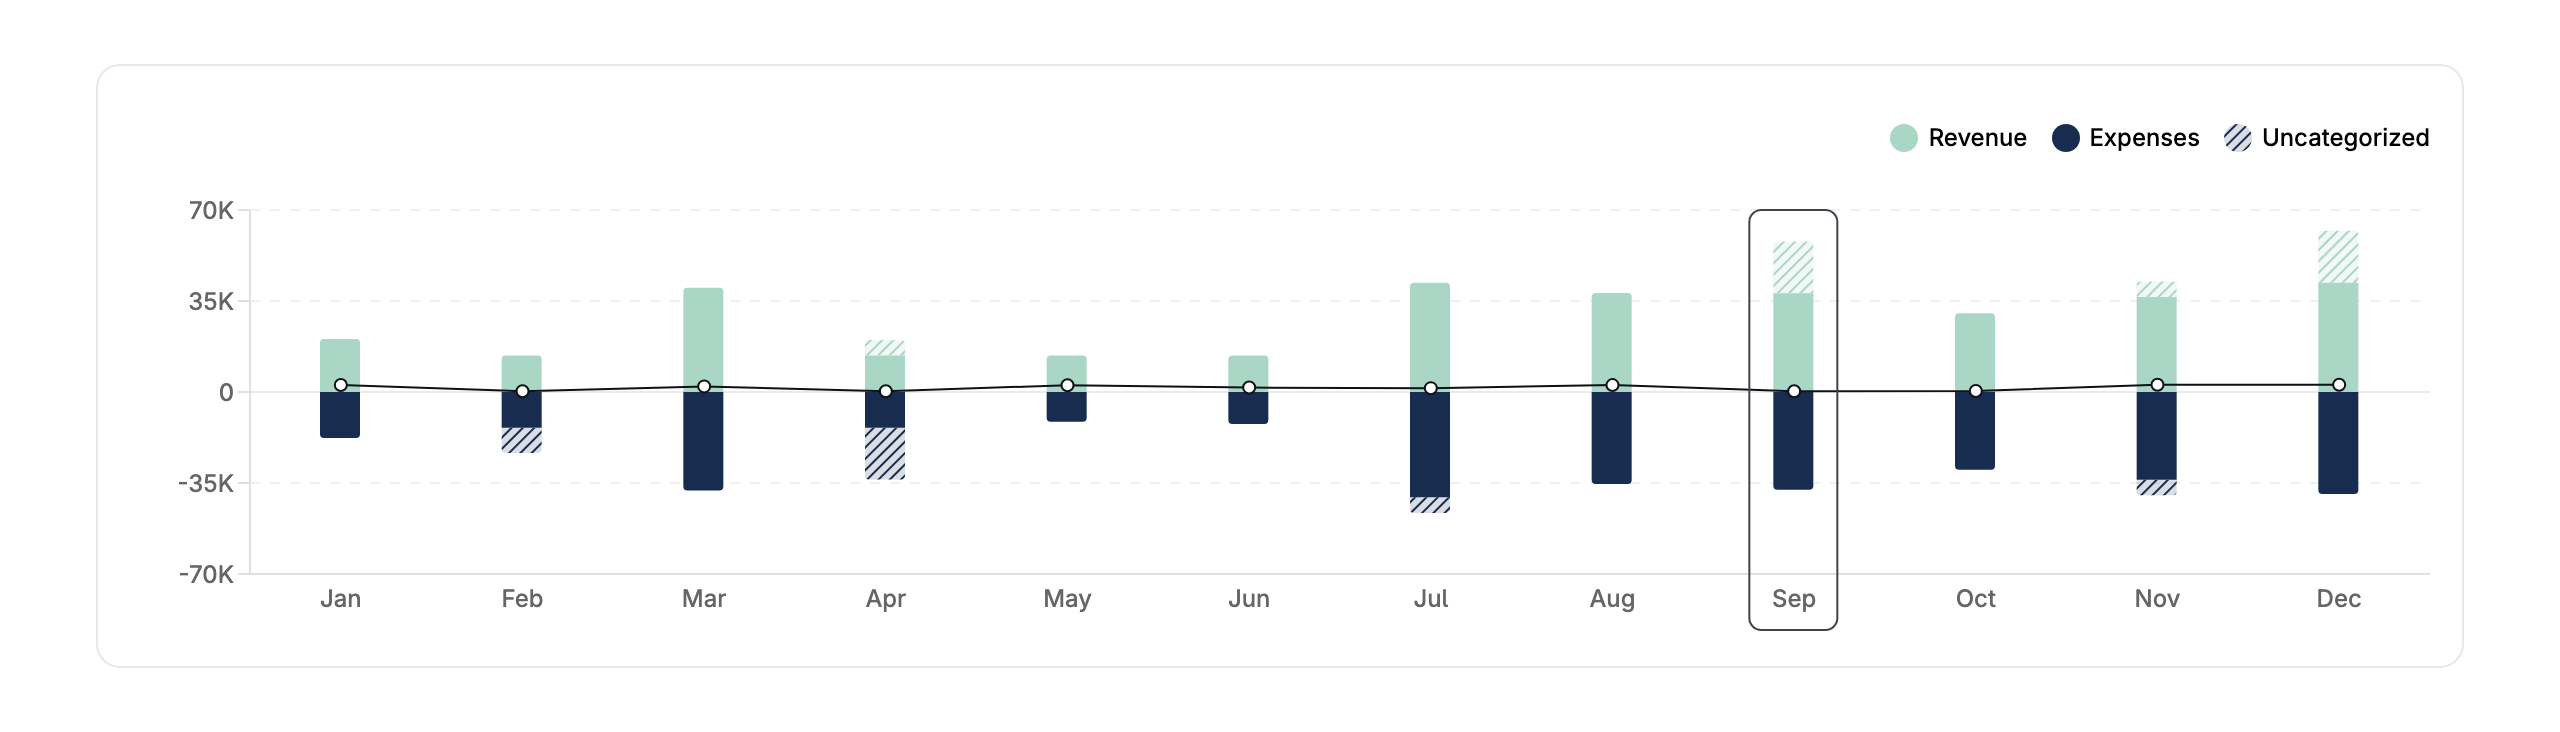
> Chart of revenue, expenses, and profit for the last 12 months.
 ```tsx theme={null}
import { ProfitAndLoss } from "@layerfi/components";
…
```
### Properties
Optional styling overrides for the chart.
Width of the bars, in pixels.
Width of the bars when the chart renders in its compact layout (below 620px wide). Defaults to half of `barWidth`.
### CSS variables
Colors and line thickness are set with [CSS variables](/embedded-components/styling#css-variables) rather than `chartConfig`, since they apply to a single fixed element rather than a per-category palette.
```css theme={null}
body .Layer__component {
/* Revenue bars. Also colors the diagonal stripe pattern on the uncategorized portion of the bar. */
--bar-color-income: blue;
/* Expense bars. Also colors the diagonal stripe pattern on the uncategorized portion of the bar. */
--bar-color-expenses: red;
/* Net profit line color. Defaults to var(--color-base-1000). */
--pnl-chart-line-color: green;
/* Net profit line thickness, in pixels. Defaults to 1. */
--pnl-chart-line-stroke-width: 2;
}
```
```tsx theme={null}
import { ProfitAndLoss } from "@layerfi/components";
…
```
### Properties
Optional styling overrides for the chart.
Width of the bars, in pixels.
Width of the bars when the chart renders in its compact layout (below 620px wide). Defaults to half of `barWidth`.
### CSS variables
Colors and line thickness are set with [CSS variables](/embedded-components/styling#css-variables) rather than `chartConfig`, since they apply to a single fixed element rather than a per-category palette.
```css theme={null}
body .Layer__component {
/* Revenue bars. Also colors the diagonal stripe pattern on the uncategorized portion of the bar. */
--bar-color-income: blue;
/* Expense bars. Also colors the diagonal stripe pattern on the uncategorized portion of the bar. */
--bar-color-expenses: red;
/* Net profit line color. Defaults to var(--color-base-1000). */
--pnl-chart-line-color: green;
/* Net profit line thickness, in pixels. Defaults to 1. */
--pnl-chart-line-stroke-width: 2;
}
```