
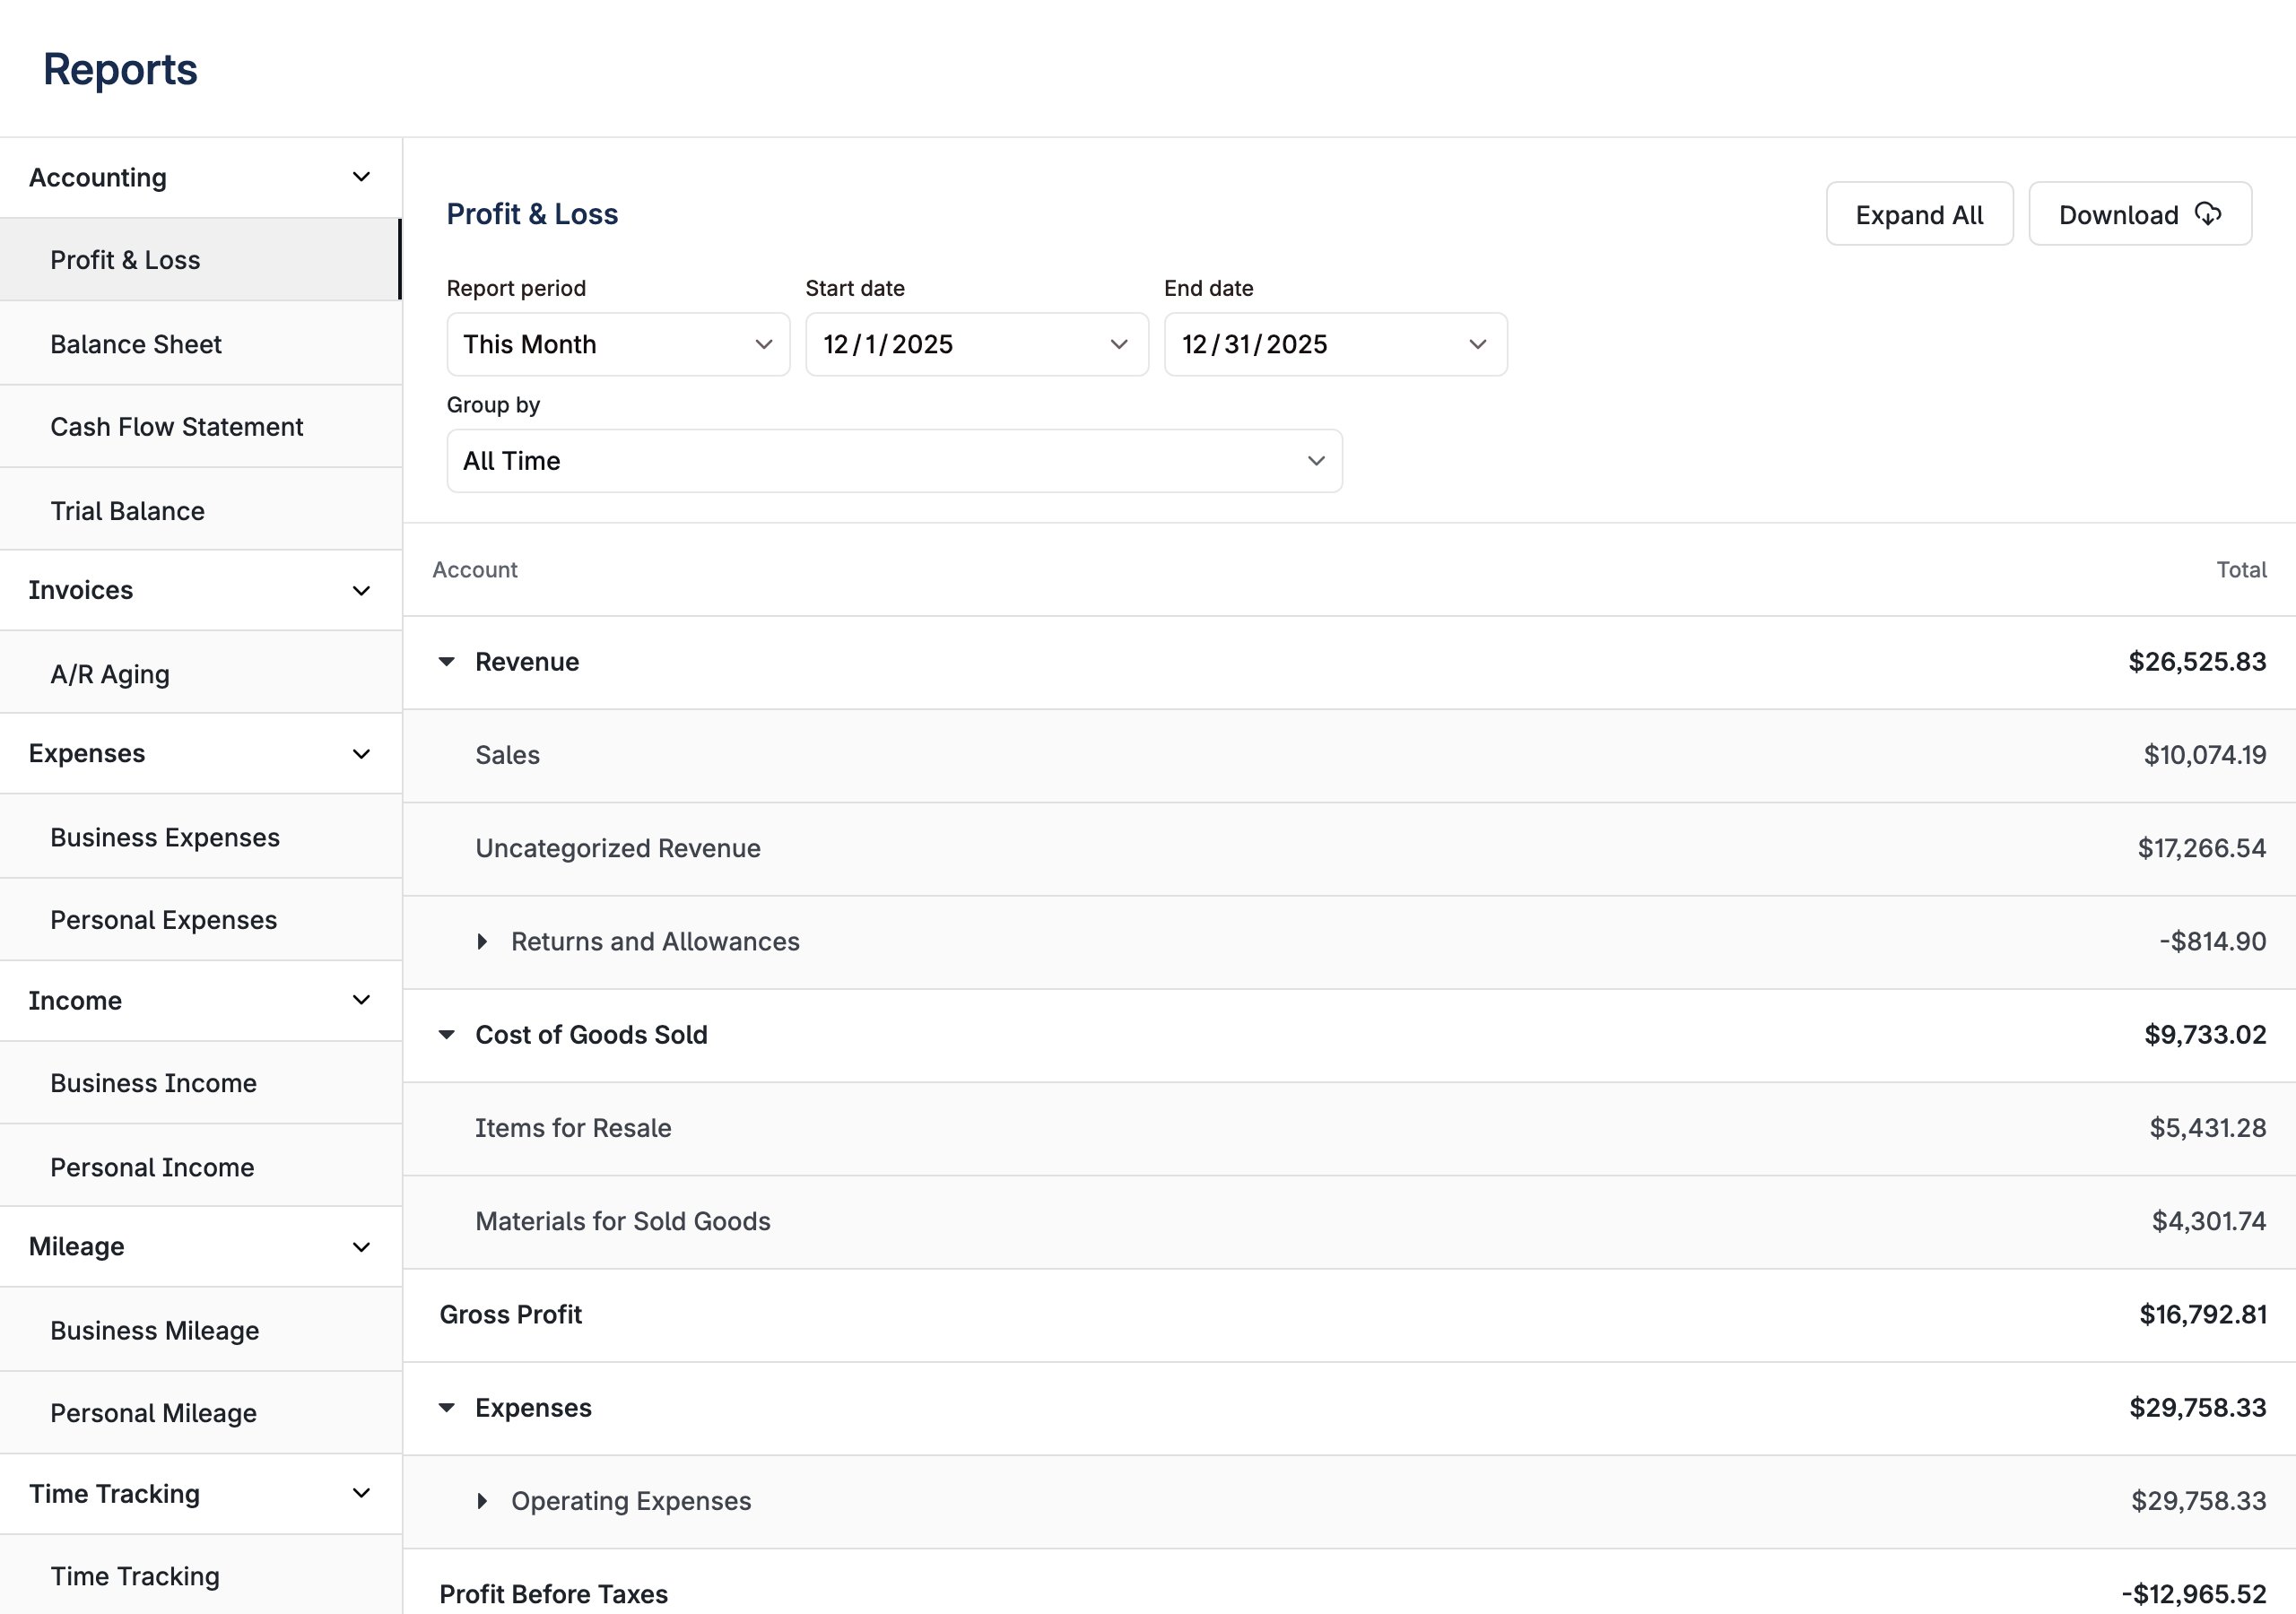
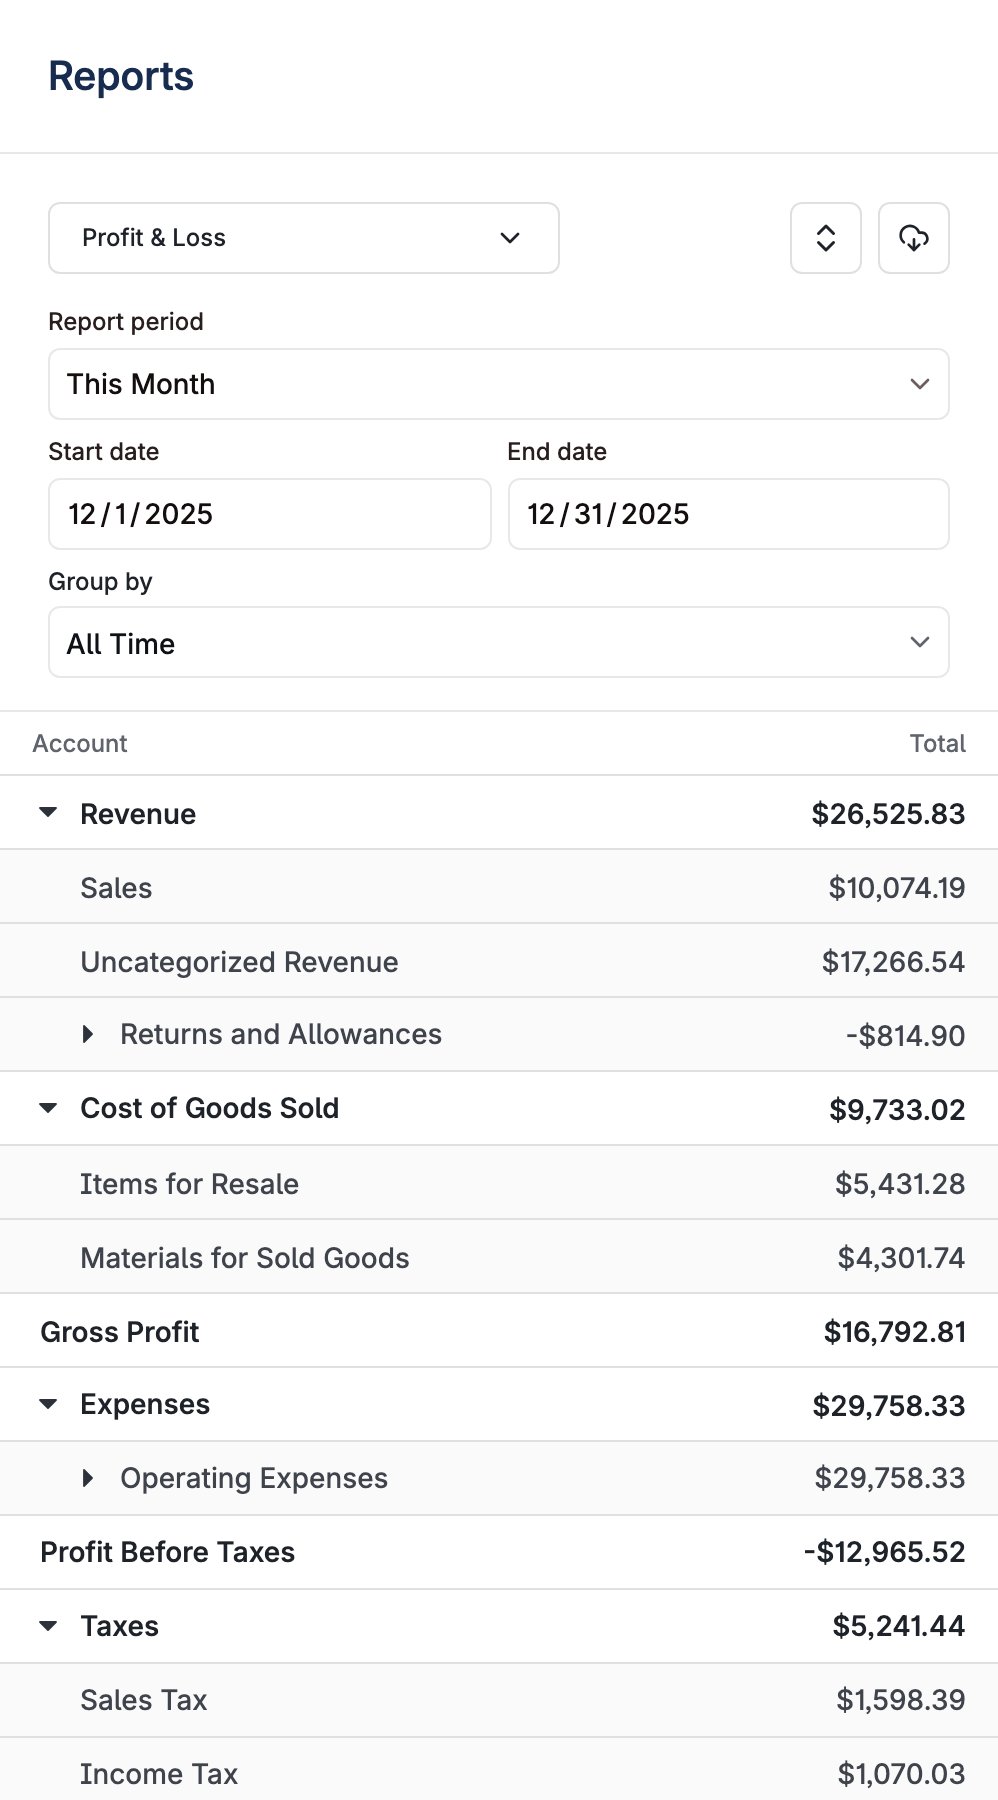
UnifiedReports layout renders the latest report experience from Layer’s embedded components. It loads all reports enabled for the business and presents them in a unified interface with report navigation, expandable report tables, and Excel download support.
Properties
Controls how report navigation is presented on desktop.
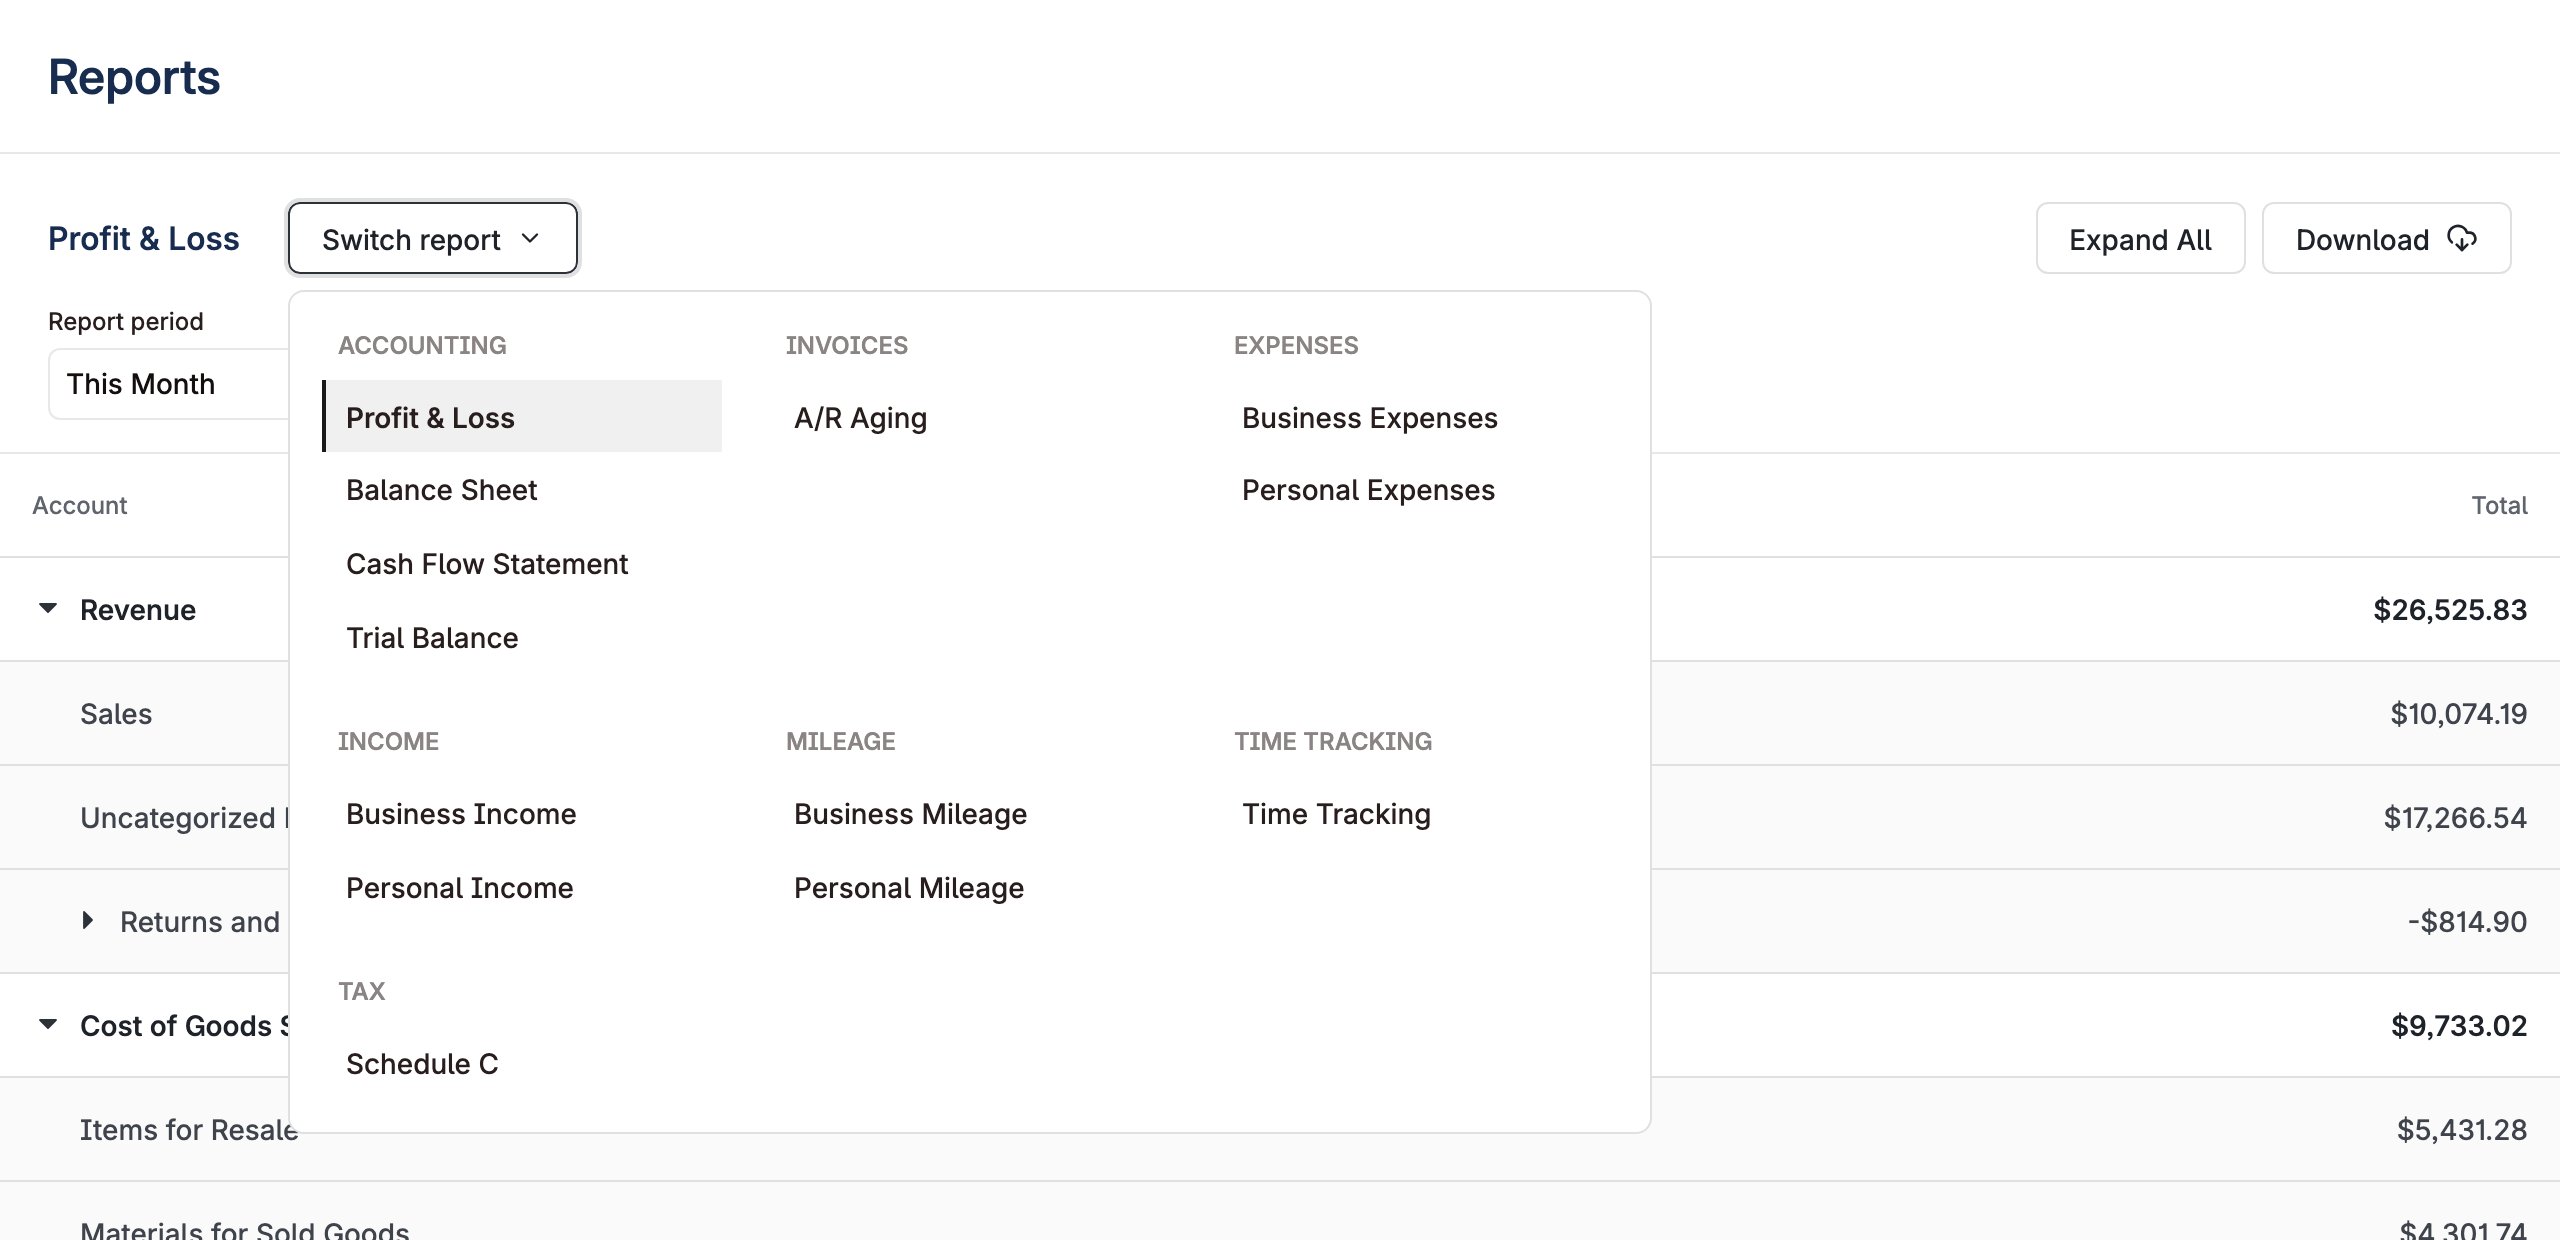
'sidebar'(default): Available reports are listed in a left-hand navigation sidebar alongside the report content.'menu': The sidebar is hidden and report navigation is presented as a dropdown menu in the report header, giving the report content the full width of the layout.
'full' | 'month' | 'year'
default:"full"
Controls the granularity of the date range picker used across reports.
{ reportKey?: string }
Opens a specific report on first load instead of the business default (e.g.
{ reportKey: "BALANCE_SHEET" }). Applied once when the report configuration loads; unknown keys fall back to the default.Behavior
The unified reporting layout combines all reports into a single standardized interface with shared controls and export formats. Reports are organized in a left-hand navigation so users can move between available reports without leaving the page. ThenavigationVariant prop can switch this to a dropdown menu in the report header instead, which lists every enabled report grouped by area:
Tag filters
If a business has a user-visible tag dimension,UnifiedReports lists one extra report per dimension. A location dimension produces Profit and Loss by Location. That report appears once the dimension has at least one tag value.
The report shows a multi-select above the table, labeled with the dimension’s display_name. Each tag value you select becomes its own column. Across more than one period, each value becomes a column group with one sub-column per period. The Excel export follows the same selection.
The business’s tag configuration drives all of this, not component props.
1
Define the dimension and its values
Send Create tag dimension with List tag dimensions shows the dimensions a business already has. To add a value later, send Create tag value. To make an existing dimension visible, send Update tag dimension with
user_visible set to true and one entry in values per location. The dimension’s display_name names both the report and the filter. Each value’s display_name becomes a column header, so a value with no display name produces a header like 27.user_visible set to true.2
Tag your entities
Apply tags with Tag entities, or send tags inline when you create invoices, payments, and payouts.Tag payments and payouts as well as invoices. If you tag invoices alone, revenue splits by location but expenses fall outside the location columns.
3
Render the component
<UnifiedReports /> picks up the new report.Define your tag values through the API. The tag pickers in Layer’s other components let users choose from the values you define. Users cannot add a new value themselves.
Each report filters on one tag dimension. A business with a
location dimension and a program dimension gets two separate reports, not one report that crosses both.